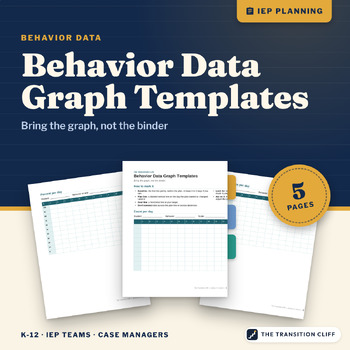
Behavior Data Graph Templates
$4.00
Digital download, instant delivery, no shipping. Refund policy
Buy on Payhip (secure checkout), $4.00
Instant digital download (PDF or the file type listed). You get the file right after checkout and a download link by email. Delivery details.
Refund policy: digital downloads are final sale, but a broken or wrong file will be fixed or refunded.
A page of tally marks does not tell a team much. The same numbers on a graph, with a line where the plan started, can settle a debate in thirty seconds. These templates make that easy to do by hand.
What's included:
• How to mark it: baseline, plan line, goal line, and when to adjust
• Count per day graph
• Percent per day graph
• Duration per day graph
• Weekly summary graph (12 weeks)
• Two behavior comparison graph and review questions
How I'd use it:
Bring the graph to the meeting, not the binder. The two behavior page is my favorite: problem behavior in dots, replacement skill in Xs. When the plan works, the lines usually cross, and everybody at the table can see it.
Each template has labeled axes and space for the student, behavior, and scale, so it is ready to fill in by hand. Graph it once a week with your data sheets next to you. It takes five minutes. Paras can learn to do it too. Bring the graph to the IEP meeting, the parent conference, or the problem solving team, and let it do the talking. The weekly summary page holds twelve weeks, about one grading period.
Who it's for: Teachers, case managers, and school psychologists. Grades K 12.
What you download: one printable PDF, 5 pages, US Letter.
Created and classroom tested by a special education teacher, with AI drafting help.